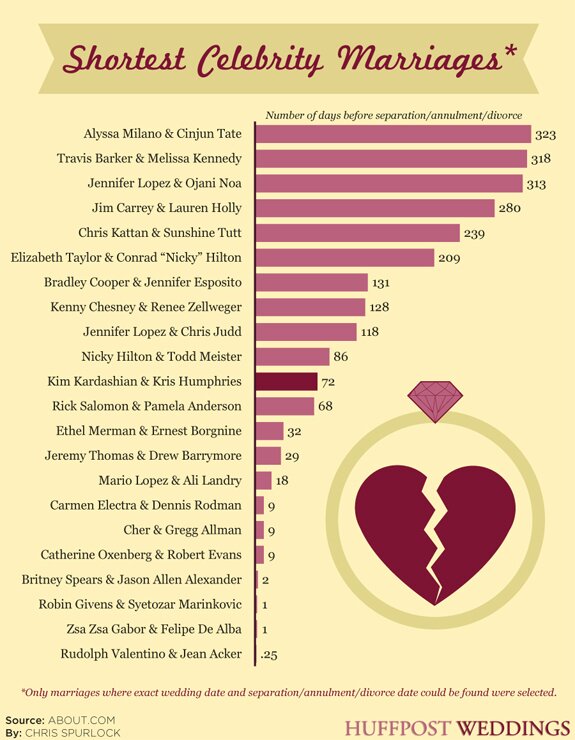
Shortest Celebrity Marriages
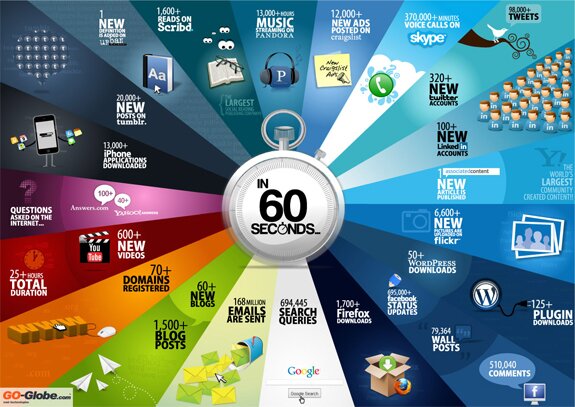
60 Seconds on the Web
Anatomy of a Web Design Agency

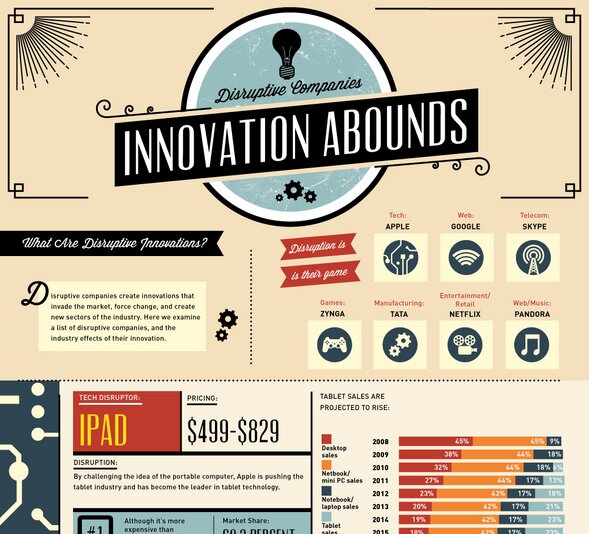
The Most Disruptive Companies in Tech
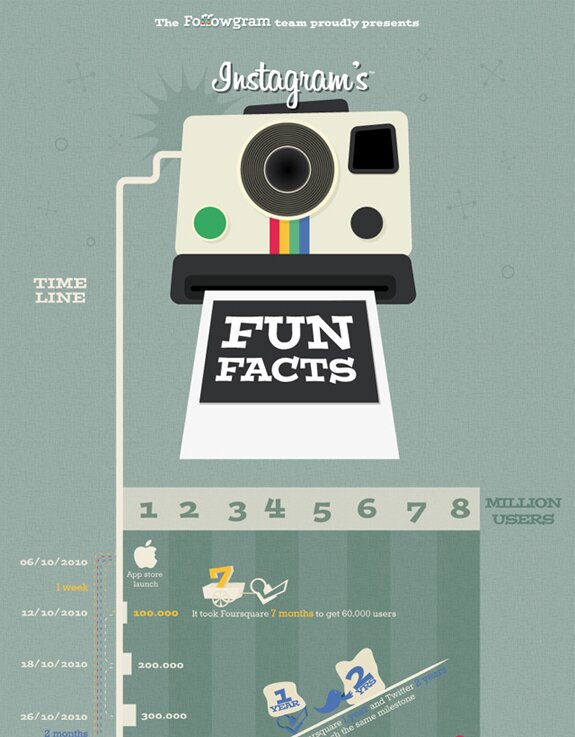
Instagram Fun Facts
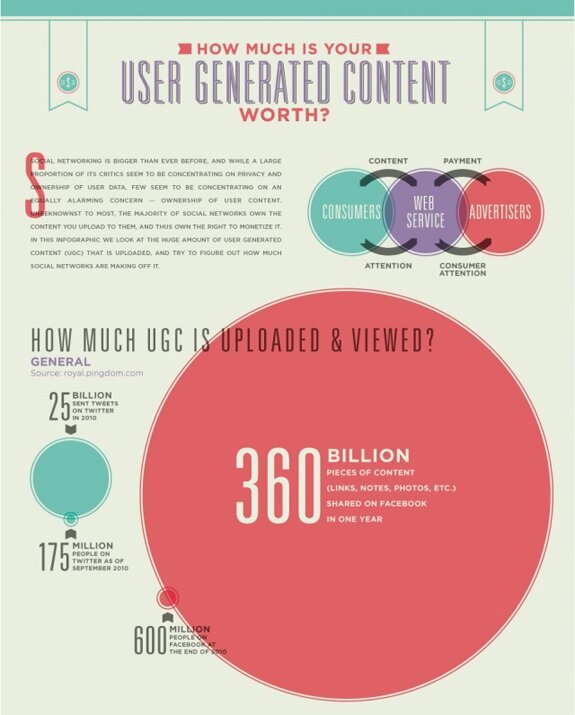
User Generated Content
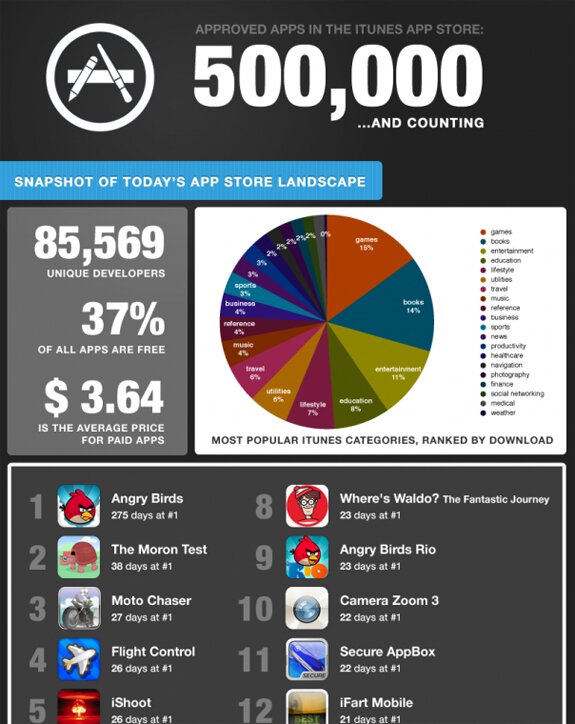
Apple App Store Sales
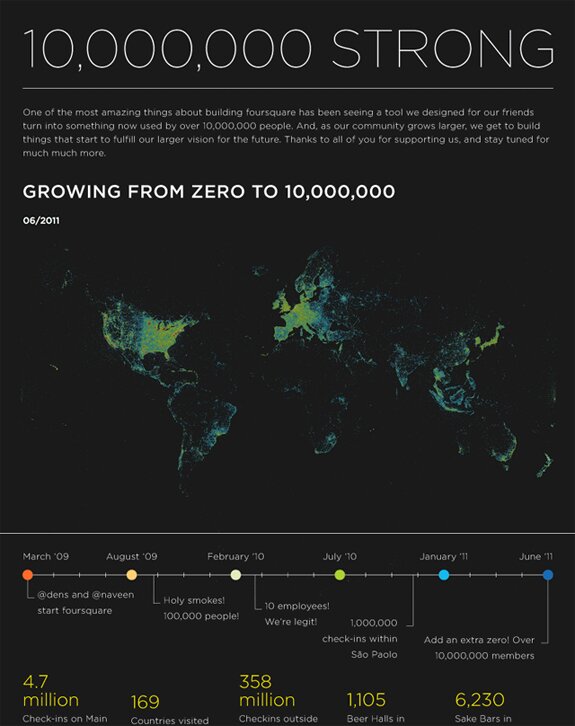
Foursquare Passes 10 Million Users
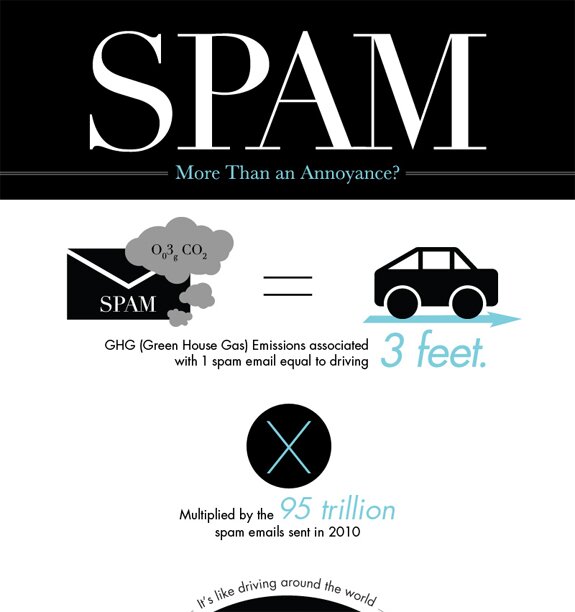
SPAM: More than an Annoyance?
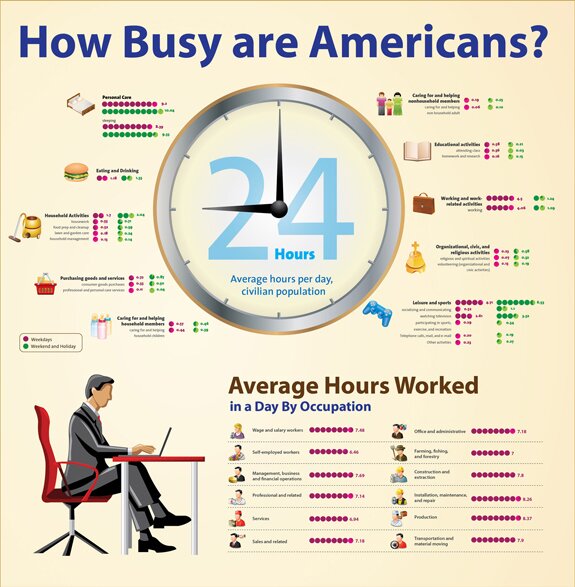
How Busy are Americans?
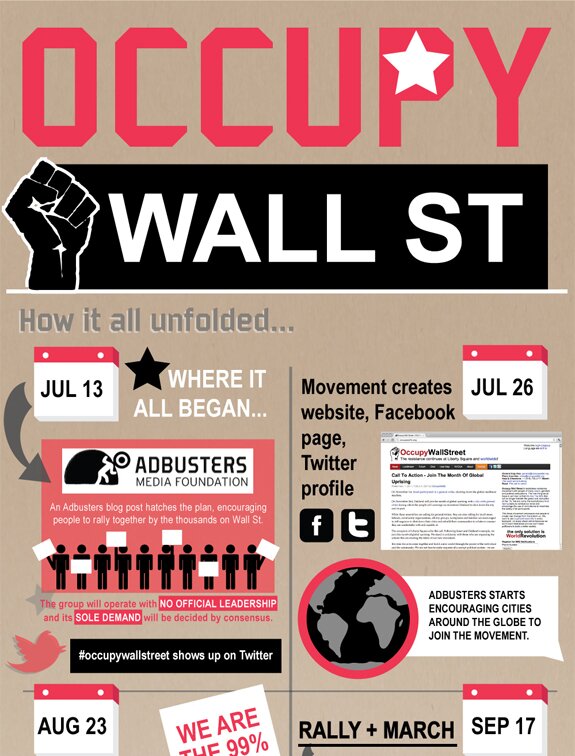
Occupy Wall Street
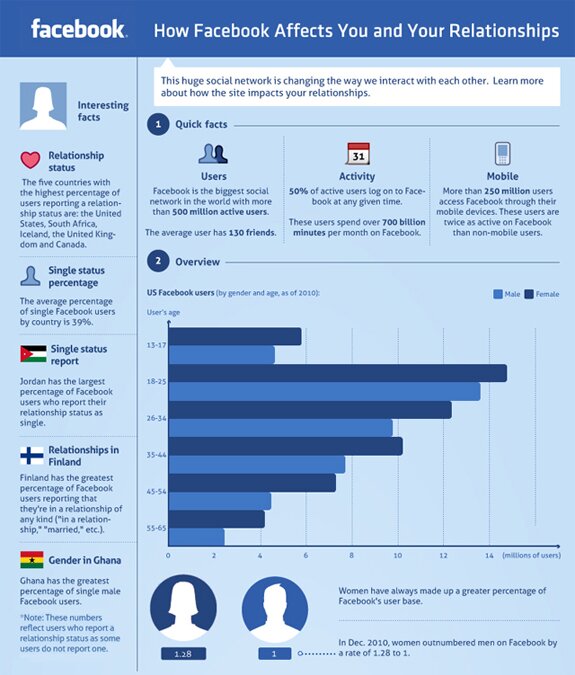
Facebook Relationships
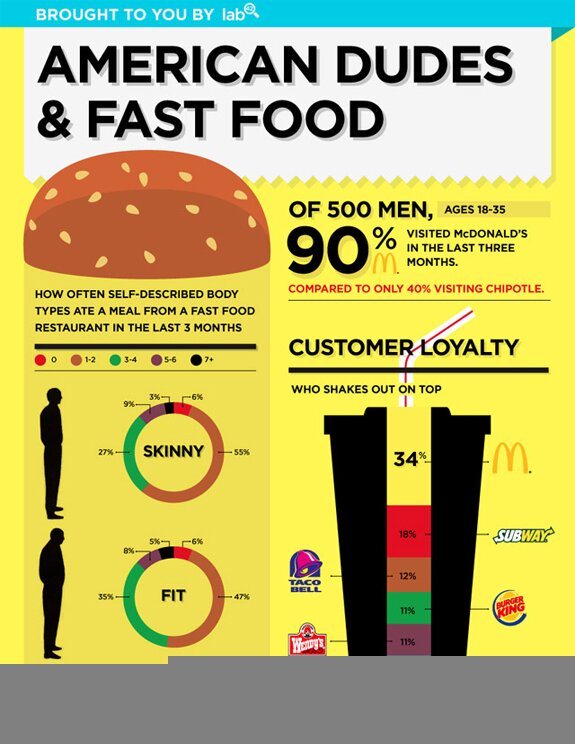
Fast Food Nation
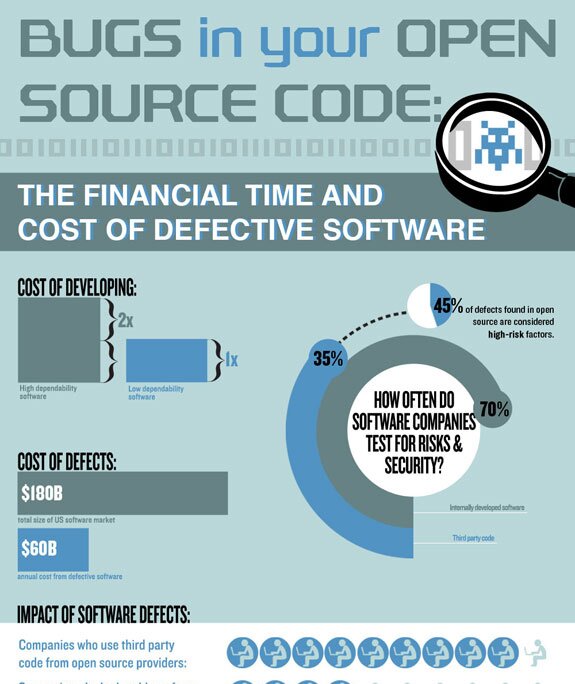
Cost of Bugs in Open Source Software
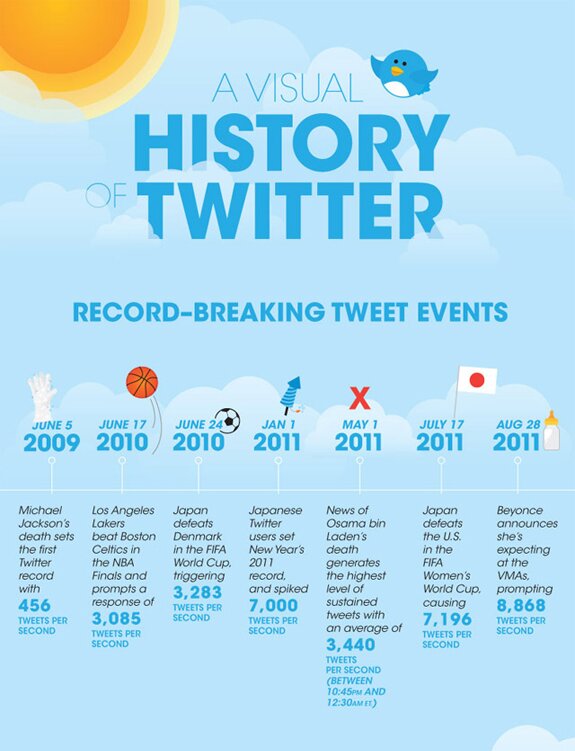
Visual History of Twitter
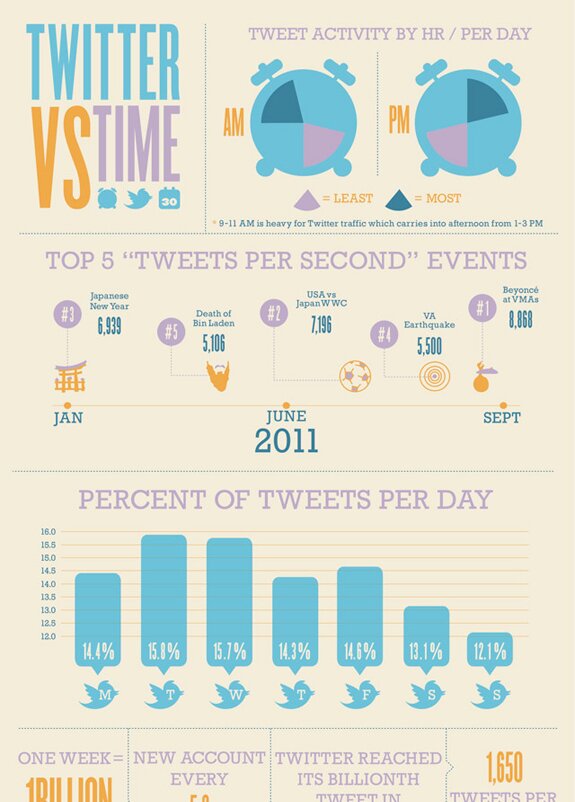
The Battle of Twitter vs. Time
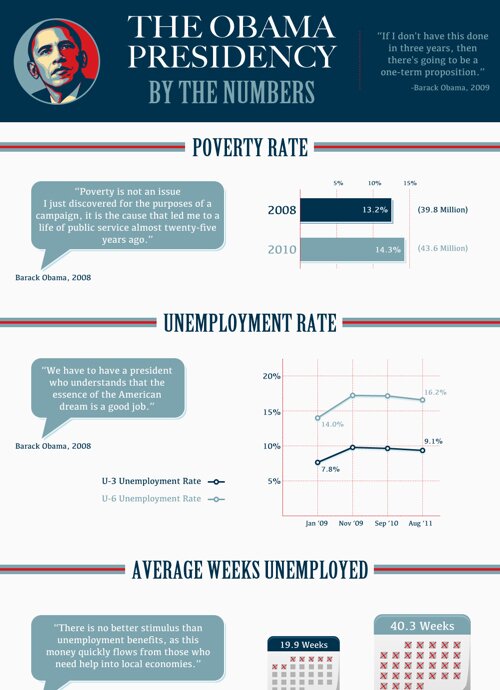
The Real Obama Presidency
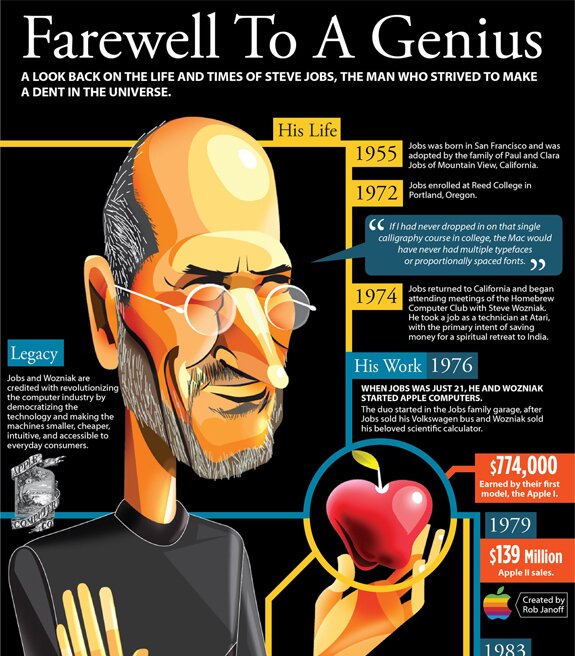
The Life and Time of Steve Jobs
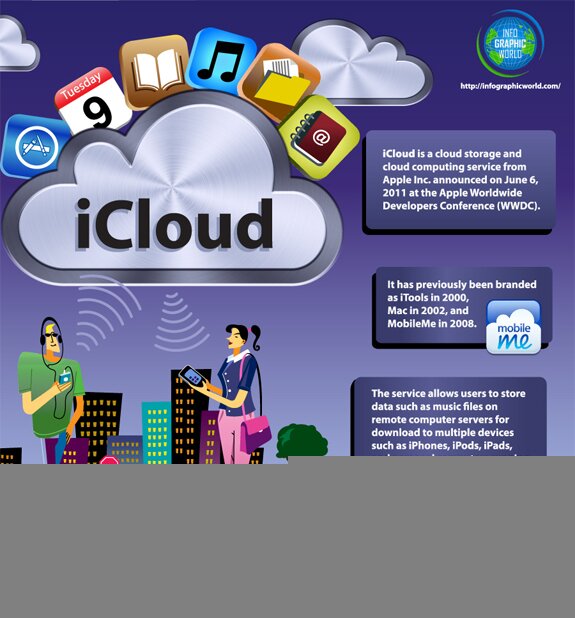
What is iCloud
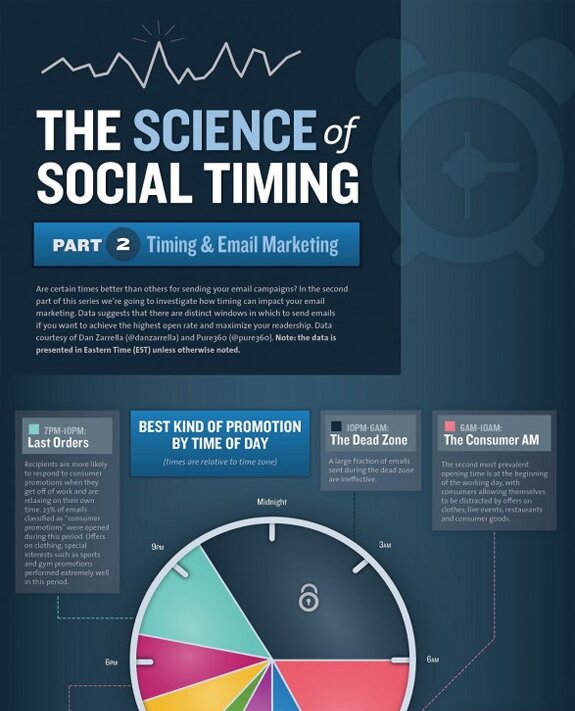
Science Studies of Social Timing
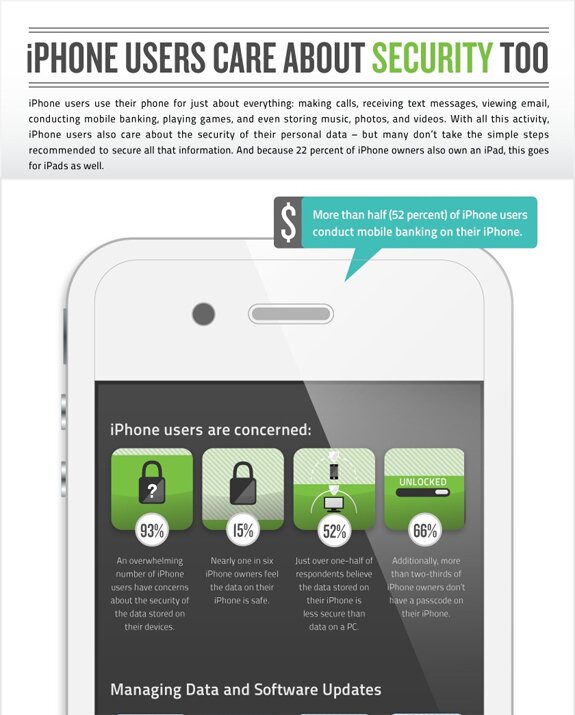
iPhone Users and Security
Who Rules Social Media

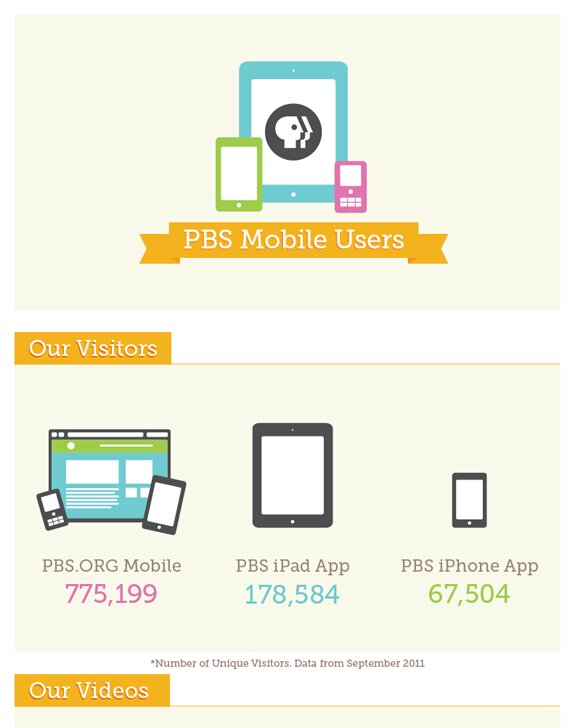
PBS Mobile Users
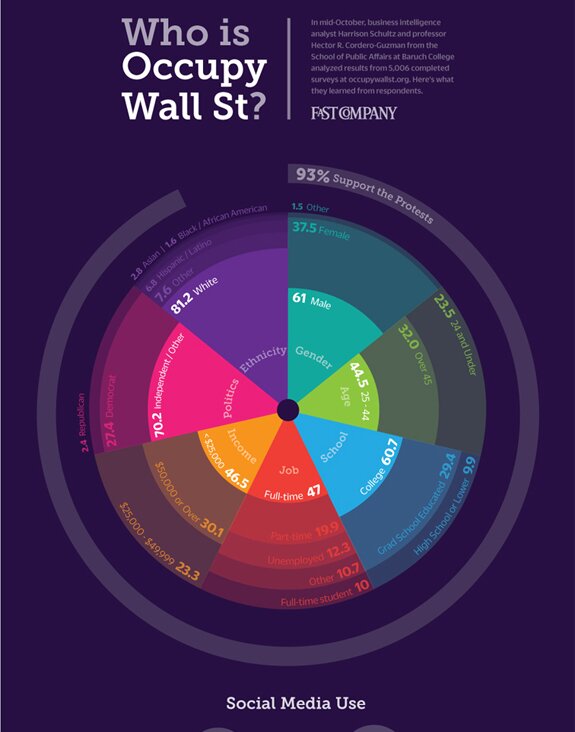
Who is Occupy Wall St?
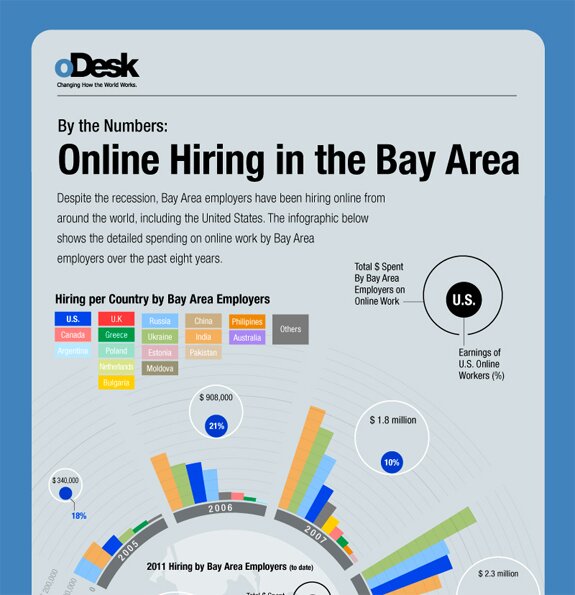
Hiring in the Bay Area via ODesk