In this article we list some useful jquery charts plugins that suit for simple to complex charts.
jQuery Sparklines
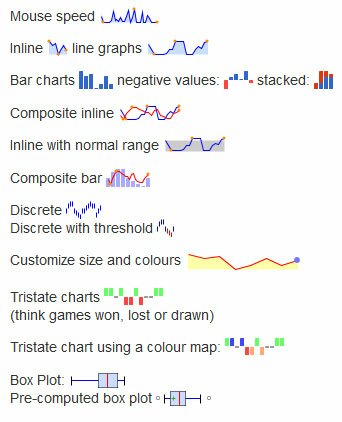
This jQuery plugin generates sparklines (small inline charts) directly in the browser using data supplied either inline in the HTML, or via javascript.
jqPlot
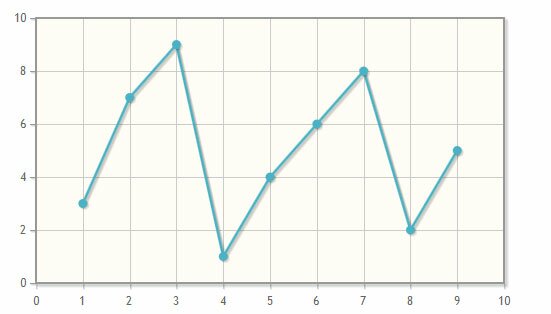
jqPlot is a plotting and charting plugin for the jQuery Javascript framework. jqPlot produces beautiful line, bar and pie charts with many features.
TufteGraph
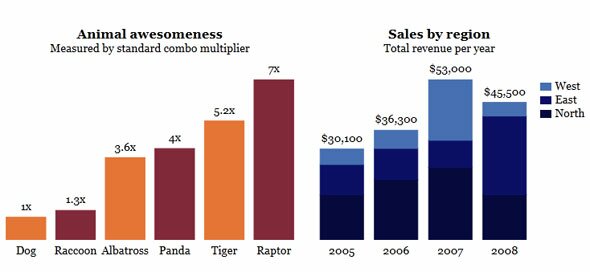
a jQuery plugin that makes pretty bar charts
Webgen Financial Budget Planner
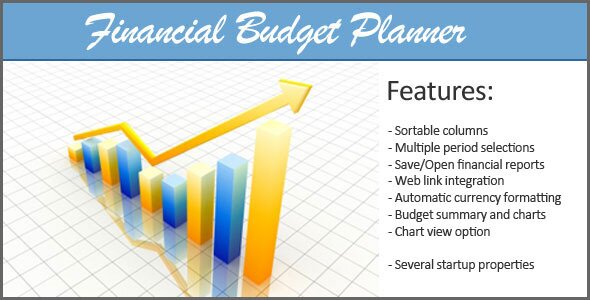
The Webgen Financial Budget planner is a finance planner that allocates future personal income towards expenses, savings and payments. The planner can be used for various budget plans such as Personal budgets, Weddings, Holidays and Business Portfolio’s etc. Reports can be saved separately as a cookie.
GraphUp – jQuery Plugin
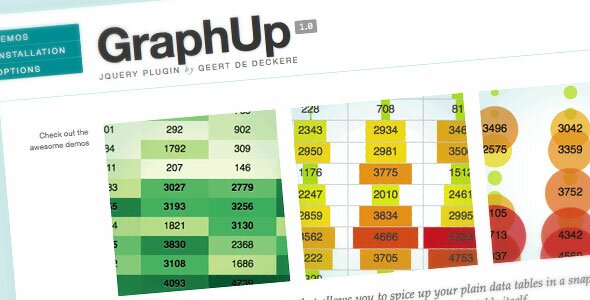
GraphUp is a very flexible and lightweight jQuery (v1.4+) plugin to spice up your data tables. It visualizes the values using color, bar charts and bubbles.
Gauge Meter
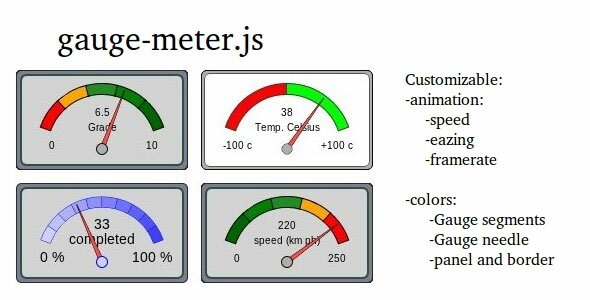
An animated gauge meter in canvas. Customisable by: -Min / Max Value -Animation (duration, eazing, refreshrate)
3D Pie Chart with JavaScript

Cool 3D Pie Chart developed in JavaScript/SVG/VML alternative.
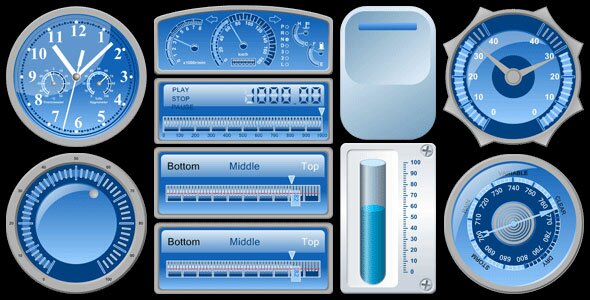
jsGauges
JsGauges is a JavaScript software that allows you to show two types of analog gauges on your web- page. That could be classical round gauges like a speedometer or linear like an ordinary thermometer.
3D Column Chart with JavaScript
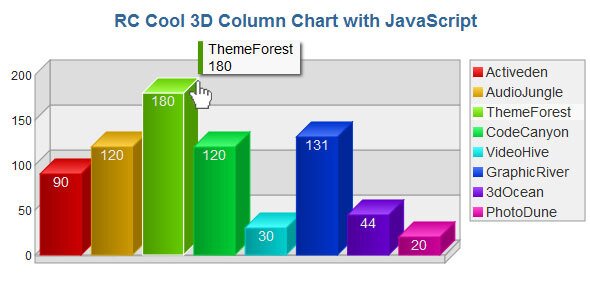
Cool 3D Column Chart developed in JavaScript/SVG/VML.
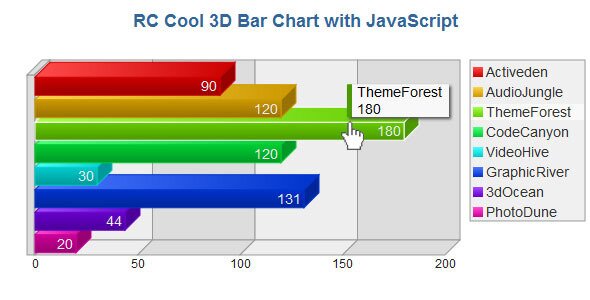
3D Bar Chart with JavaScript
JavaScript Gauges in Metro Style
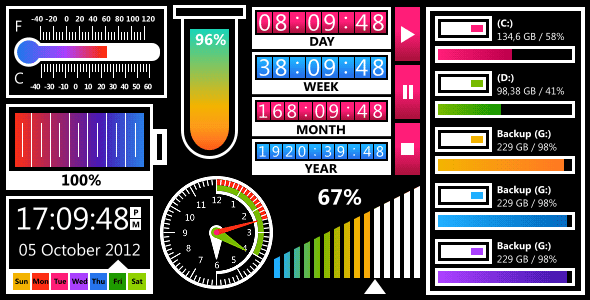
JavaScript Gauges in Metro Style is a set of 8 gauges created in the modern Windows8 or Metro style which can be added to virtually any web application: ASP, ASP.NET, PHP, JSP, ColdFusion, Ruby on Rails, and simple HTML pages.
HTML 5 / SVG Dynamic Charts
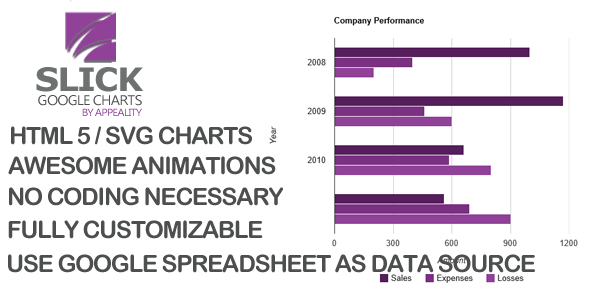
Display live data on your site with the new HTML 5 / SVG Google Charts API. We have made it super easy for you to add modern, cutting edge charts to your website, blogs, CMS, mobile, etc in minutes.
Points Calculator
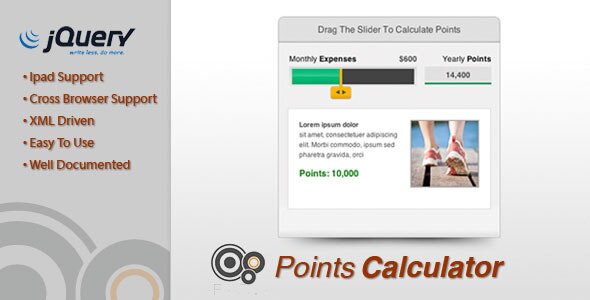
Use this simple calculator to display points and rewards. Users see how quickly their points can add up and get rewards.
Slidy
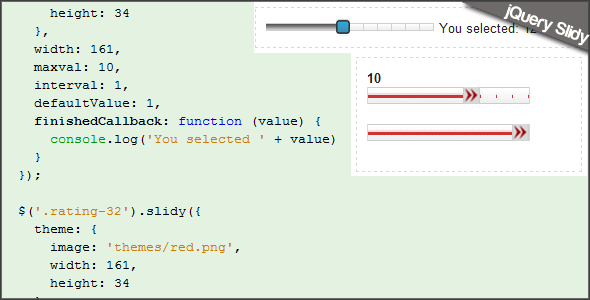
A jquery plugin to make a slider bar quickly! It turn any block element into a slider bar which user can move the pointer to select a value! It supports theming with only one image without any extra css! Using is very simple, just import file and apply plugin and you have your bar to select value! Simple markup, no extra css!
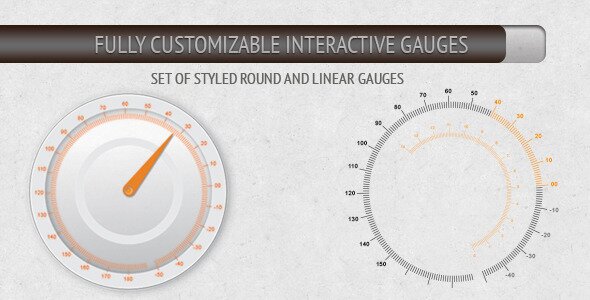
SVG -based Gauges for JavaScript
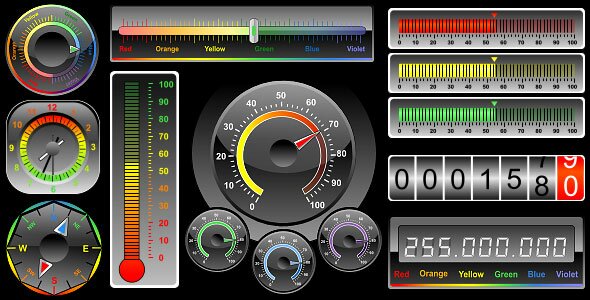
A library of 10 gauges includes horizontal, vertical, and radial gauges created in good-looking unified style. Every gauge is presented in JSON format making it easy to modify its settings and integrate a gauge into a web page with just basic knowledge of HTML and JavaScript.
JGraphUI – Flowchart and Diagram Editor
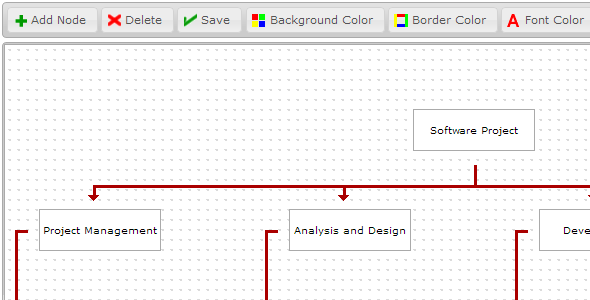
JGraphUI is a rich feature and highly customizable yet easy to use diagram tool and flowcharts, you can create, manipulate and save flowcharts and other types of diagrams.
isoChart
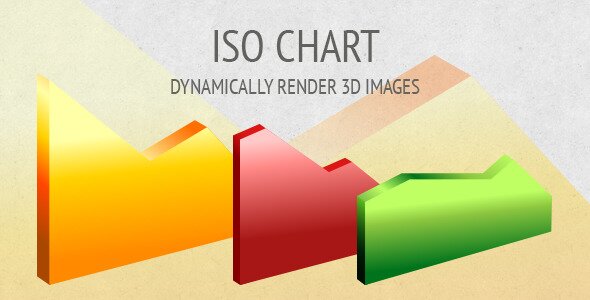
Script was created to render isometric charts using SVG or VML vector graphics. isoChart dynamically renders pseudo 3D image with interactive nodes. Script architecture allows you to register your own event handlers and callback functions. isoChart is a cross-browser solution that works with all modern browsers and Internet Explorer.
HTML5 (JavaScript) Gauges Library
HTML5 (JavaScript) Gauges Library is a set of 10 gauges which can be added to virtually any web application: ASP, ASP.NET, PHP, JSP, ColdFusion, Ruby on Rails, and simple HTML pages.